Case study · Choice Hotels International

Rates page optimization

Clearer room rates for travelers, with an estimated $14M in annualized revenue. An A/B study on the site optimization and growth team.

My role
Product designer: A/B strategy, analytics review, wireframes, UI, high-fidelity comps, dev handoff, UAT and production QA
Team
PM, Analytics, Research, lead engineer
Timeline
2 months
Company
Choice Hotels International

The rates page was losing visitors, and it left people unsure which room to book. I redesigned the page to make the choice clear. Conversion rose about 2%, customer service calls went down, and the page is still live.

The problem

Visitors could not compare rates with confidence. What the data and testing showed:

  • Analytics showed a 40% abandonment rate.
  • Abandonment was highest among visitors who landed on the rates page without visiting the home page.
  • User testing found people were confused about which rate to choose.
  • Premium amenities were hidden, so price differences between rooms did not make sense.
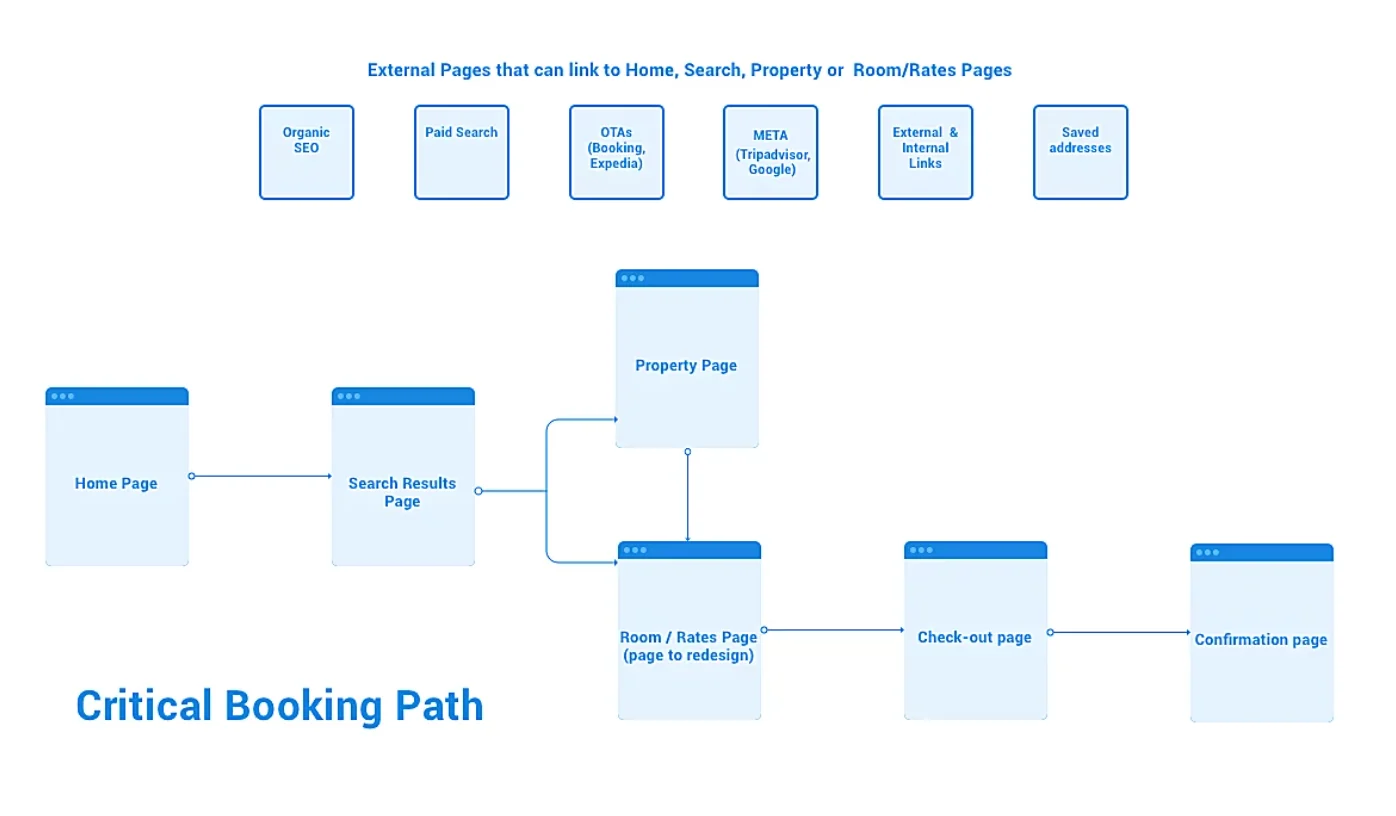
Flow chart of the booking path. Home leads to search results, which lead to the property page or the rates page. The rates page is labeled as the page to redesign, then checkout and confirmation follow.
The critical booking path. The rates page sits between search and checkout.
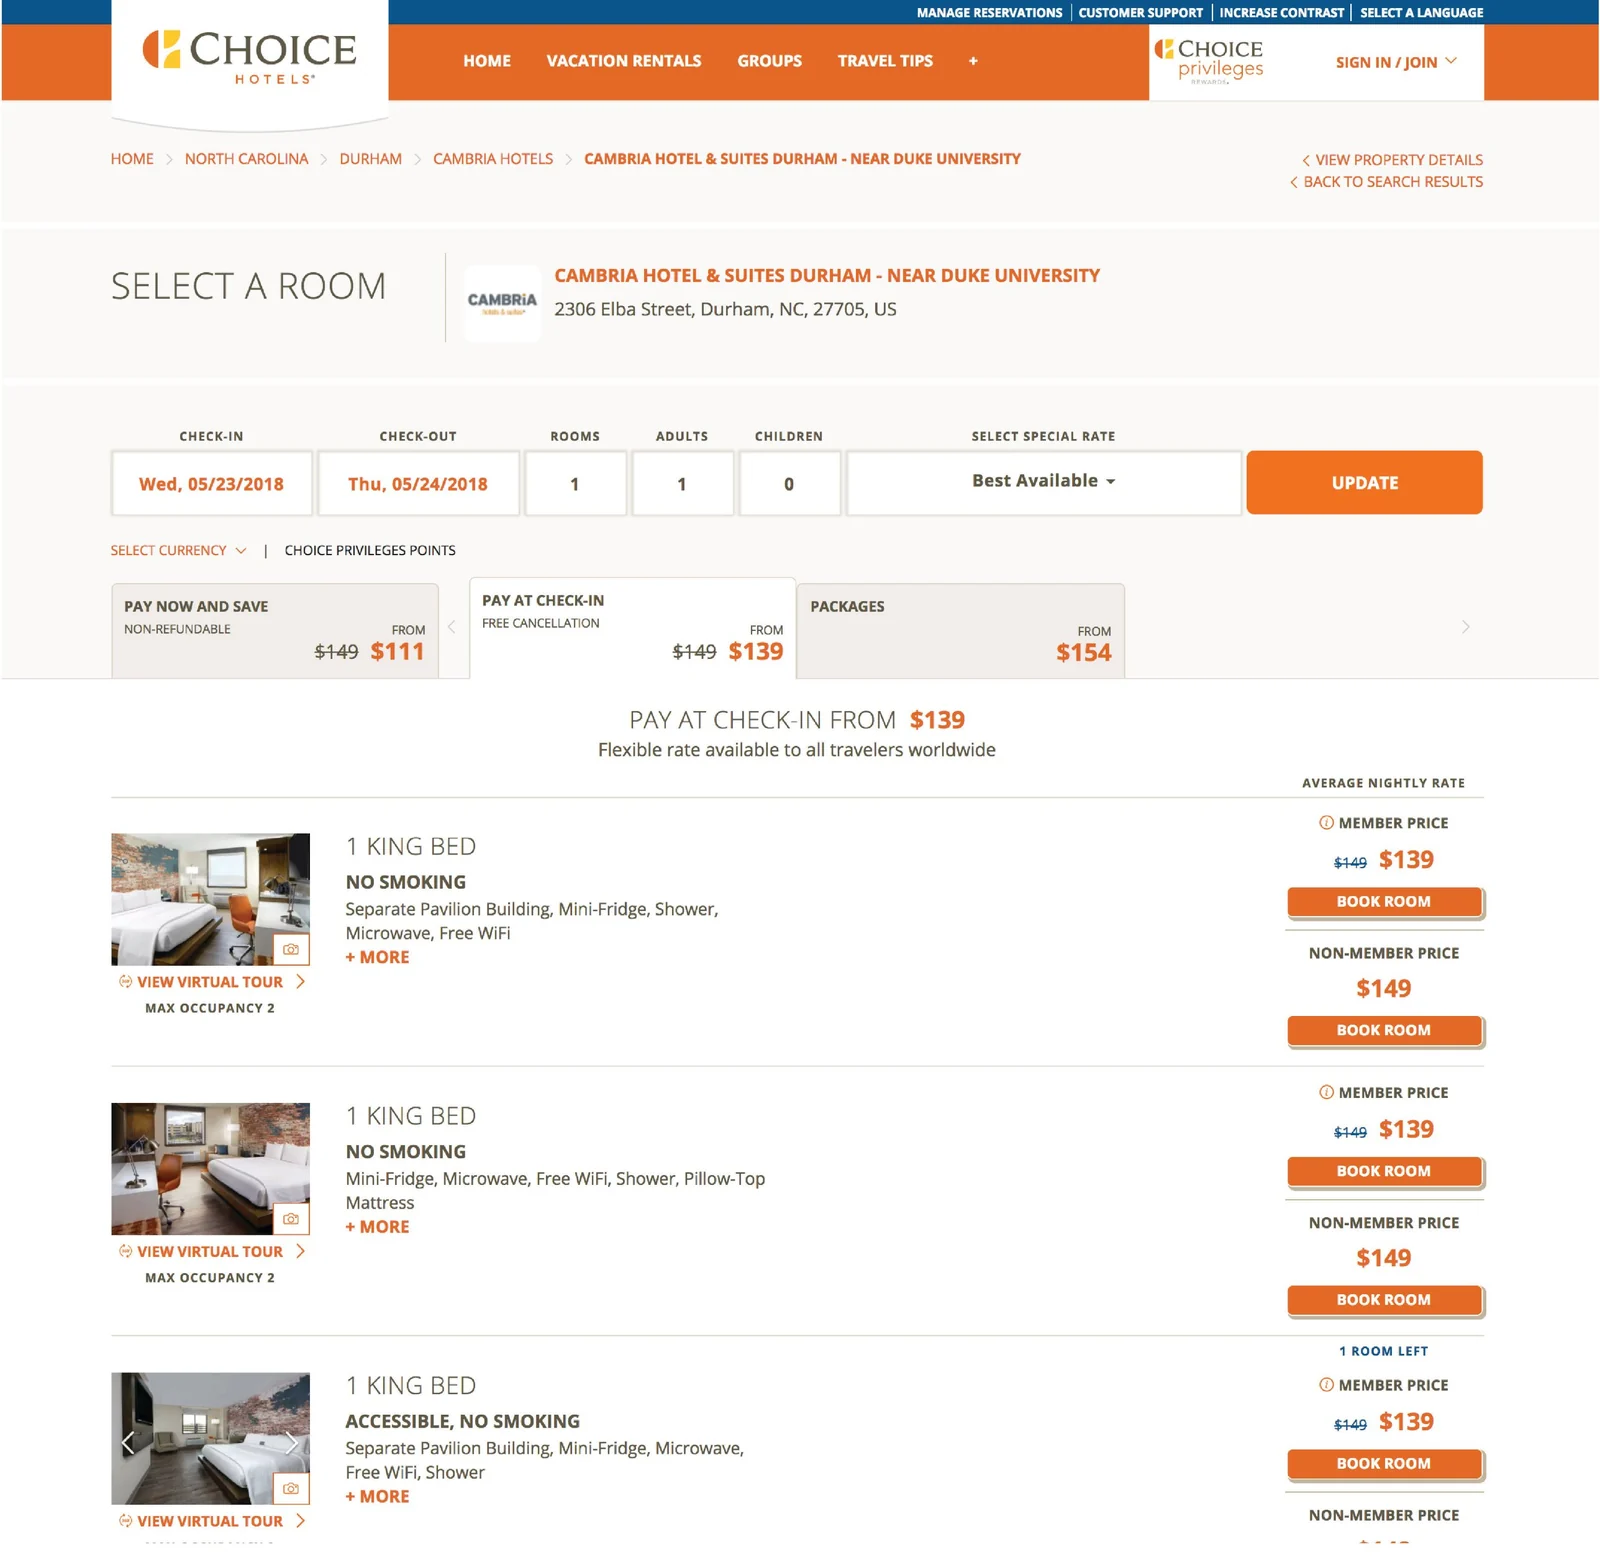
Current room selection page with three room rows, each showing a photo, amenities, and member and non-member prices
The current rates page before the redesign.
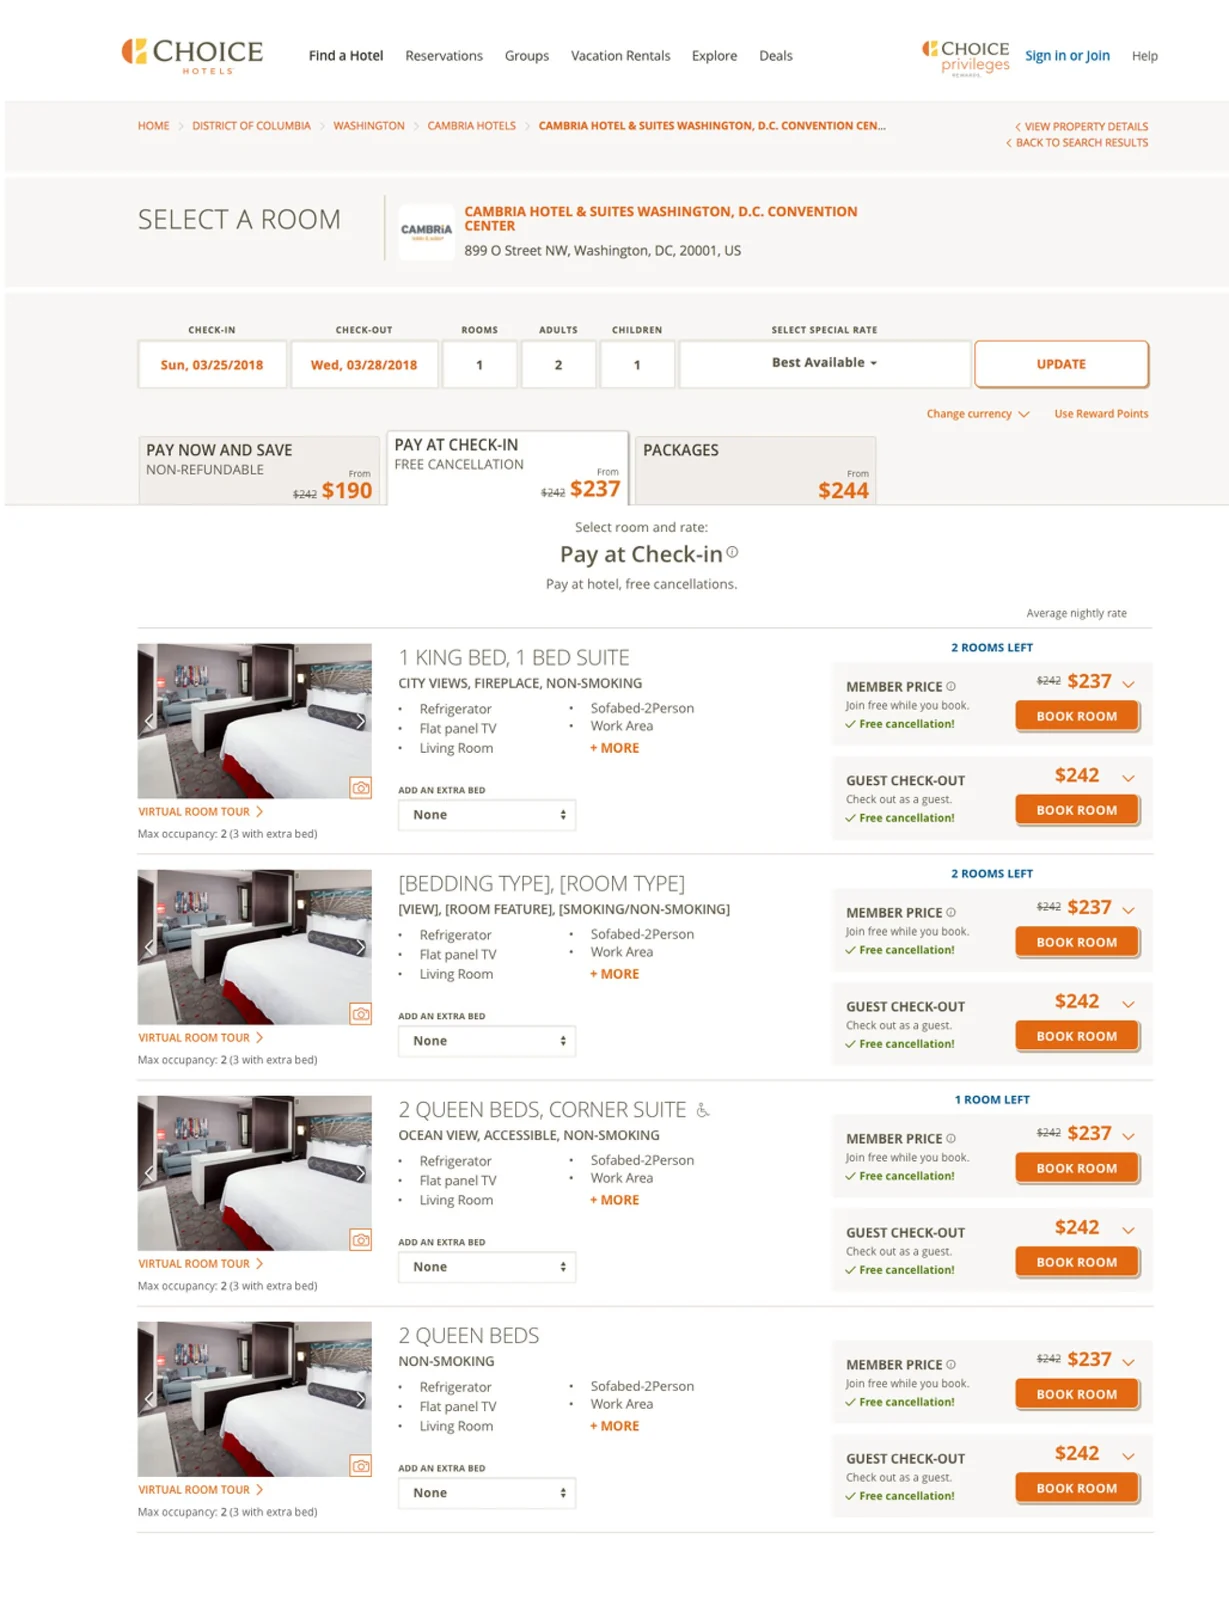
The final redesigned rates page with room options, member and guest rate cards, and Book room buttons
The final rates page.

The audience shaped the design

The main audience was older travelers. Many feel uneasy with new websites. That set four design priorities:

  • Reduce clutter.
  • Present information in small chunks.
  • Minimize friction.
  • Meet AA accessibility standards.
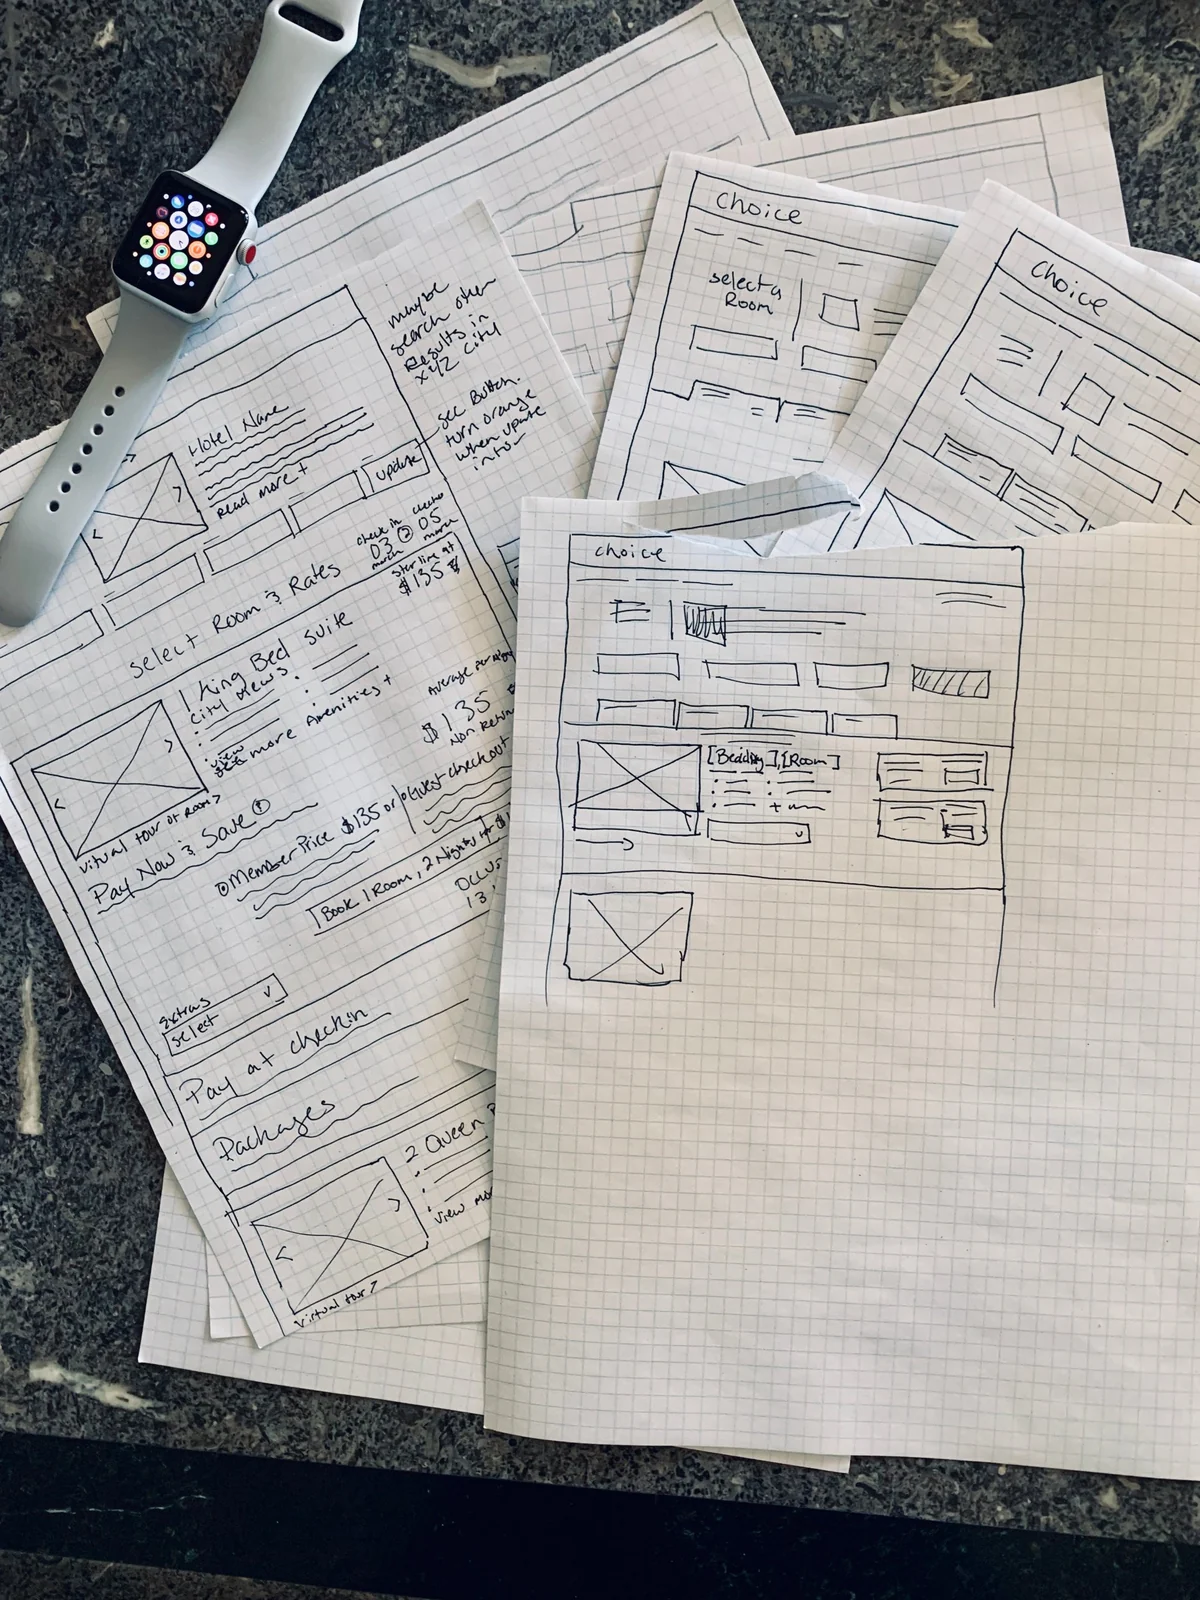
Pencil sketches on grid paper showing room selection layouts with price blocks and a room photo area
Early paper sketches of the rates page layout.

Key decisions

Show premium amenities with each rate

Decision Surface the amenities that explain the price next to each rate.

Options Keep amenities behind a details link.

Why Hidden amenities made price gaps look random. When the reason for the price is visible, the choice makes sense — and doubt goes away.

Design for the least confident user

Decision Small chunks, less clutter, fewer steps.

Options Optimize for power users and speed.

Why The main audience was older travelers uneasy with new websites. Clear, small chunks help everyone, not just them.

Tie every test to a goal and a measure of return

Decision Each A/B test was planned with the PM and dev lead, with analytics measuring ROI. Some days had several iterations.

Options Test whatever seems promising.

Why Fast testing only works when each test answers a question. Involving analytics early kept the case for each change honest.

Protect accessible rooms

Decision Design the flow so accessible rooms stay open for guests who need them.

Why Accessible room codes decreased — fewer guests booked them by accident, and franchise owners did not have to reshuffle reservations.
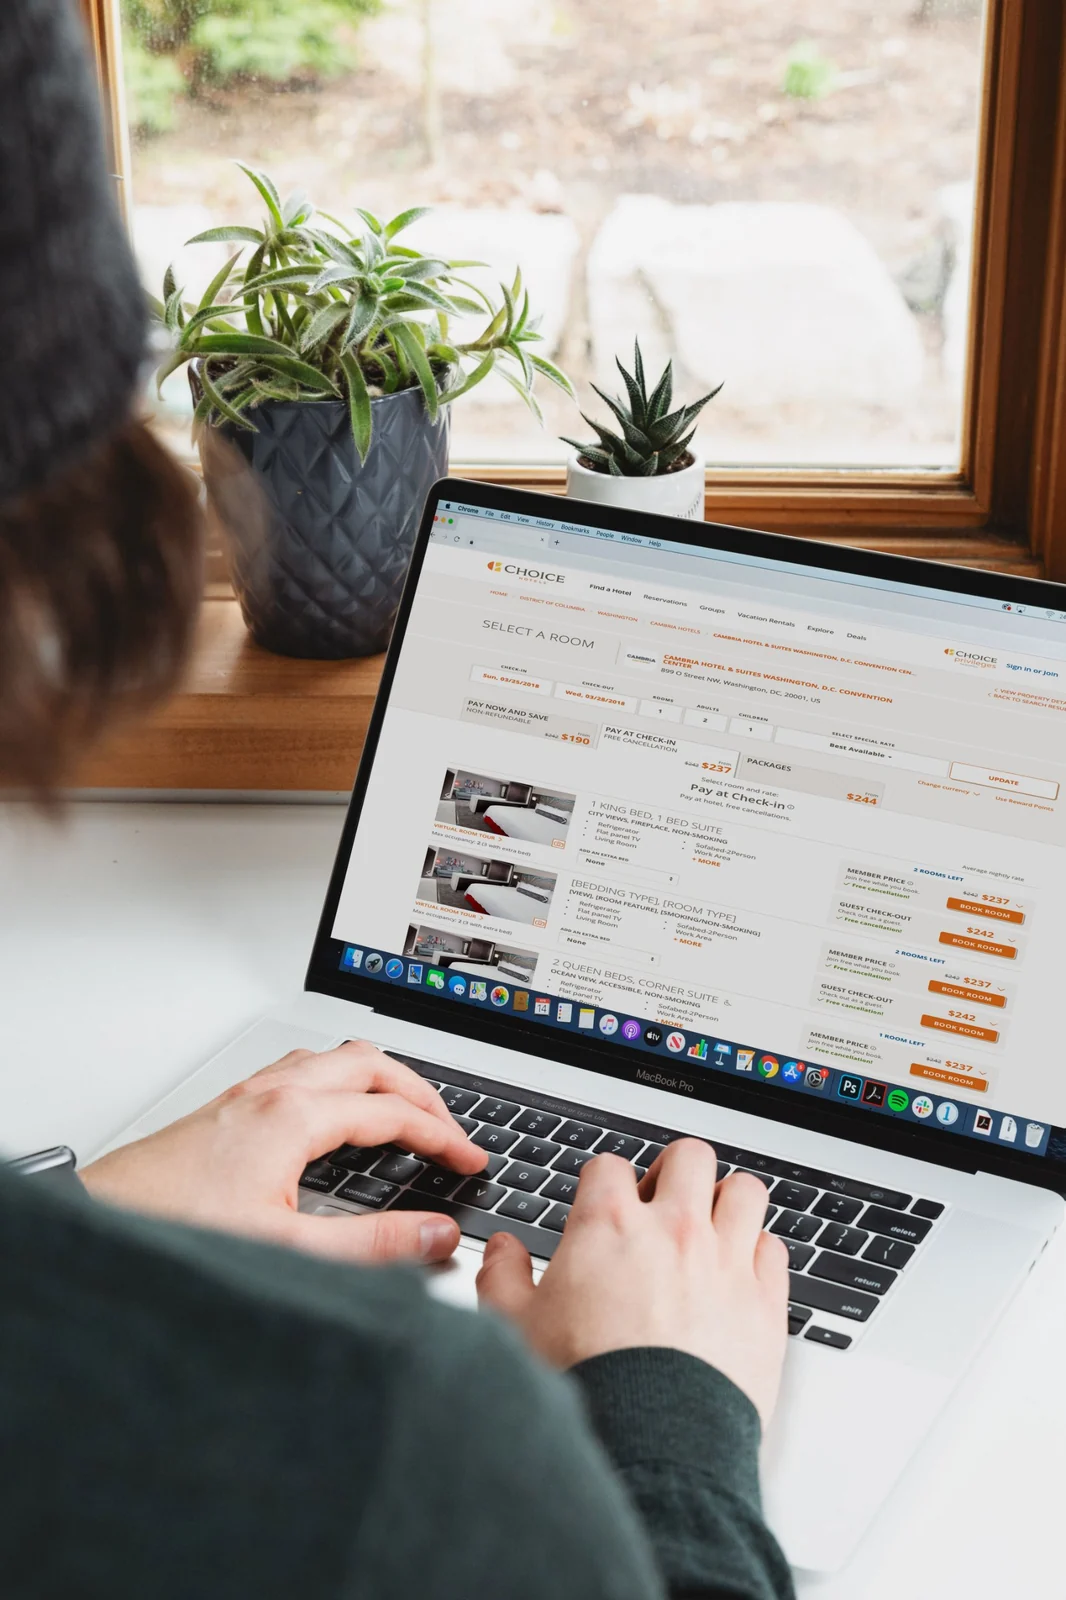
A person typing on a laptop that shows the redesigned rates page with room cards and prices
The redesigned rates page on a laptop.
A desktop computer showing the redesigned rates page with room options and rate buttons
The redesigned rates page on a desktop.

Results

+2%

conversion in the core A/B test

$14M

estimated annualized revenue (range $3M – $26M)

Fewer

customer service calls after launch

Estimated annualized revenue ($ millions)

Low estimate$3M
Estimate$14M
High estimate$26M
The estimate and its range from the case study. Bar length is scaled to $30M.

Other wins

  • Reservations shifted about 1.5% toward member rates. Loyalty auto-enrollment rose about 2%.
  • Accessible rooms stayed open for guests who need them.
  • The page increased revenue, boosted loyalty membership, reduced frustration for franchise owners, and remains live.

Reported change (%)

Conversion, core A/B test2%
Loyalty auto-enrollmentabout 2%
Reservations to member ratesabout 1.5%
Each bar is a separate reported change. The bases differ, so do not compare the bars directly. Bar length is scaled to 2.5%.

What I learned

  • Hidden details create doubt. Show key facts where people decide.
  • Test fast, but tie every test to a clear goal and a measure of return.
  • Involve analytics early. It keeps the case for a change honest.
  • Design for the least confident user. Clear, small chunks help everyone.

I am proudest of pushing to optimize this page in the first place. The data showed it was a priority.